Category Archives: Supply, Demand and Equilibrium

Questions for Classroom Discussion on Supply, Demand and Equilibrium

Keeping in mind the economics of Dybvik’s article, consider the fairness of the following:

  • While ethanol is considered a substitute for gasoline, not all consumers will choose to use ethanol.  However, all consumers will ultimately face higher prices for corn-based food products because “the trend has been to divert some corn production to ethanol.”   
  • Transportation companies are adding fuel charges to invoices, driving up the prices of goods sold by retailers who pay these fuel charges.
  • A justification for charging higher prices for food is that higher prices force consumers to eat healthier and buy locally.

Posted by Prof. C-S

Cause and Effect in the Economy

Discussion on Bruce Dybvik’s “The Ripple Effect: Cost of gas and groceries go hand in hand” (Dunn County News, July 30, 2008).

More than ever before, the world is more interconnected. Events occurring in one place do not only have direct effects to the surrounding area but may have subtle indirect effects in different parts of the planet. Like a pebble thrown into a pond, one factor may send waves of positive or negative influence to multiple economic sectors. One such example of this phenomena is explored by Dybvik’s discussion of the effect of gas prices on food prices in the United States.

According to Dybvik, this ripple effect is known as “wavefunction” and comes from quantum physics.  He explains that in wavefunction “nothing happens in isolation, or simply that everything consists of and is affected by waves.” Dybvik relates this effect to the positive correlation between rising prices for petroleum and food in 2008.

A recent study from the Wisconsin Farm Bureau Federation found that “retail prices of 20 food items in 26 communities showed an increase of 4.3 percent in the second quarter” (2008).  The same article concluded oil prices play a significant role in the rising cost of food. Not only does the rising cost of fuel increase shipping costs, but many products are also shipped in petroleum-based packaging that has also become more expensive.  Supermarkets are forced to pass these higher costs onto the consumer in the form of increased prices for food. This effect is seen in the rise of prices of corn-based food products because of its heavy reliance on energy-dependent processing that is becoming increasingly expensive.

In addition to increasing the cost of food, higher oil prices have also affected consumer and retailer behavior. Tied by the inelastic demand for food, consumers have found themselves searching for any means to reduce their total expenditure in the face of rising prices. Dybvik found that supermarkets have seen a decrease in the frequency of purchases but increase in the amount purchased. Experts attribute this to individuals’ desire to save on gas. There is also a shift to an increase in the purchase of private label products. Supermarkets themselves have modified their purchase behavior by purchasing locally and less frequently to reduce the impact of shipping expense on price. Consumers are now finding themselves concentrating on foods that will stretch their budgets and last longer than a single meal.

Dybvik pulls on a Wisconsin Farm Bureau Federation report that states, “Oil prices are at the heart of inflation seen in all sectors of the economy, including food.” He goes on to explain how the price of oil has changed consumer buying behavior, increased retail prices, and, even, altering food preparation. It is very clear that oil prices have a large effect on the price of food and food-related products because it is a large input in production; however, external supply and demand factors separate from oil prices may cause movement in the economy.

Historical data show that oil prices and inflation have not always been perfectly correlated. An Investopedia article, explains that the connection between oil prices and inflation is seen in the 1970s but has significantly decreased since then. Dybvik’s statement is also too general and fails to account for every sector of the economy. Recently, inflation, in general, has been low. Although it is true that retail and food sectors have been increasing their prices to incorporate higher oil costs, Mark Lacter, a business analyst for KPCC, a Los Angeles radio station, points out in an interview that the housing sector is one part of the economy which price is not affected by oil.

At the time Dybvik’s article is written, the housing bubble is just about to burst. We all know the story. Oil was an input in the production of houses but since buyers were no longer willing to purchase houses, quantity supplied exceeded quantity demanded pushing the price of houses to be lower despite increasing oil prices.

The unfortunate event of the Japanese tsunami of 2011 aptly illustrates the supply and demand model. More specifically, producers of various electronic products, whose facilities have been critically damaged as a result of the natural disaster, have had to persevere as best as they could. While countless companies attest to the severity of the impacts, producers such as Toshiba who make electronic chips – used to store data for electronic devices such as digital cameras and smartphones – may be one of the most critically affected. As a result, prices jumped from $7.30 to $10, demonstrating the direct, short-term result of the tsunami.

The following S&D diagram illustrates this point.
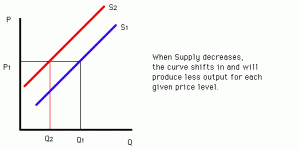
 

At this point, it is important to realize that the demand for the microchips are relatively inelastic: the change in the quantity demanded is smaller relative to the change in prices. This inelasticity could be explained by the necessity of the chips in countless products, such as: flat-panel displays and other components used in devices like computers, tablets, digital cameras, blu-ray players and televisions. The following diagram illustrates the difference between elastic and inelastic demand.

The left diagram illustrates how price is relatively unresponsive (inelastic) to the corresponding decrease in quantity, whereas the right diagram shows how even a small change in quantity triggers a heavy increase in price (elastic).

Moreover, it is worth mentioning how suppliers of other products are affected. For example, automakers who depend on internal components from companies such as those aforementioned also face  the inability to produce, and thus challenge to meet demand. Toyota, along with almost every other Japanese automakers, was forced to halt production as they were unable to receive the necessary components for their vehicles from their suppliers. IHS iSuppli, a research firm, estimated that the plant production shut-downs/stoppages could cut automaker output by up to 250,000.

Posted by Andrew, Anne, Nico and Will (Section 4)

Resources:

http://www.investopedia.com/ask/answers/06/oilpricesinflation.asp#axzz1kDVhkUDi

http://www.scpr.org/programs/businessupdatewithmarklacter/2012/01/10/inflationandoilprices/

http://www.nytimes.com/2011/03/15/business/global/15supply.html?pagewanted=all

http://www.time.com/time/business/article/0,8599,2059444,00.html

http://www.uri.edu/artsci/newecn/Classes/Art/INT1/Eco/S_D/Gifs/supply.in.gif

http://www.google.com/imgres?um=1&hl=en&sa=N&biw=1440&bih=799&authuser=0&tbm=isch&tbnid=GJoPSSYEuuKOM:&imgrefurl=http://www.uri.edu/artsci/newecn/Classes/Art/INT1/Mic/Elast/index.elast.html&docid=tqvzHxPa9_-gkM&imgurl=http://www.uri.edu/artsci/newecn/Classes/Art/INT1/Mic/Gif/elasticity0.gif&w=487&h=201&ei=wtsdT8i8FPLgsQLg27SdCw&zoom=1&iact=hc&vpx=137&vpy=286&dur=3008&hovh=144&hovw=350&tx=111&ty=110&sig=110172692780708428366&page=3&tbnh=76&tbnw=184&start=59&ndsp=35&ved=1t:429,r:14,s:59

“The Ripple Effect”, A Blog Write-Up

Discussion on Bruce Dybvik’s “The Ripple Effect: Cost of gas and groceries go hand in hand” (Dunn County News, 2008)

The economic concept of supply and demand is perhaps the most abundantly utilized economic theory in the present day market. It is the main determinant in setting prices for all of today’s goods and services. The main focus of “The Ripple Effect”, written by Bruce Dybvik, is to show how price changes in one market can cause price changes in another, and more specifically, how fluctuations in petroleum prices can cause price changes for certain foods.

Mr. Dybvik begins his argument by discussing wavefunction, the quantum theory that nothing occurs in isolation, and applying it to economics.  Because every action has some sort of reaction, markets that might be seemingly independent of one another, are in fact connected via the economic system.  Specifically, the oil market plays a major role in connecting diverse markets, such as food.

In particular, petroleum is necessary in the production, transportation, and selling of food products.  It is worth noting that some foods require higher petroleum costs than others based on their size, content, packaging, etc., and are thus more influenced by changing prices.  Thus, as the price of production increases, suppliers will likely push at least some of these costs onto the consumer, causing food prices to increase.  Because of this, Dybvik then delved into consumer purchasing behavior by examining how people are choosing to purchase food in larger quantities, less frequently.

Thanks to these extra fuel charges, not only are consumers suffering from higher prices, but retailers are being hit hard as well with extra “fuel surcharges” (note that not all new costs due to higher oil prices can be pushed onto consumers, as customers will stop buying if costs get too high). These added costs have pushed people do change their shopping preferences. People have become more prone to buy local, longer lasting items, and stay in and cook meals, rather than eat out. Many local food markets have become bigger supermarkets in their towns, since the local population has become more prone to travel less for groceries.

In conclusion, this article encompasses all of the supply and demand topics we discussed during lecture this week. We can see how the price only affects the quantity supplied/demanded, and not the actual Supply/Demand itself. The article also gives some examples pertaining to the income and substitution effect (using corn to make ethanol, a biofuel and gasoline substitute).  All in all, “The Ripple Effect” is a very interesting and educative article in relation to the economic concept of Supply and Demand.

In the article “The Ripple Effect”, Dybvik states that, “oil prices are at the heart of inflation in all sectors of the economy including food.”  This is a truth that is inherent in the economy, although it may not be initially obvious.  Oil is a main input in the economy, impacting everything from transportation to production to distribution.  With few exceptions, oil impacts prices, at least to some degree, in all industries.  However, Dybvik incites oil prices as impactful on inflation.  When one thinks of inflation, the first input that comes to mind is monetary supply and the behavior of the Federal Reserve.  Furthermore, inflation tends to draw to mind the concept of the diminishing purchasing power of money.  However, the diminishing purchasing power of money is simply a result of inflation, which is technically defined as a broad-reaching increase in prices across an economy.  From this perspective, because oil prices have such a direct effect on multiple industries, increases in oil prices create increases in prices across the board (in other words, inflation).  In this way, Dybvik is accurate in his assessment of oil prices as a major component of inflation.

The ripple effect can be seen throughout the American economy.  Consider, for example, the fast food industry, where input prices have seen a drastic increase in recent months.  Beef, bacon, and cooking oil have all experienced price increases; these costs in turn have been affected by overall economic conditions.  Cooking oil, in particular, which was a topic of conversation in Dybvik’s article, is directly correlated with the price of petroleum.  In turn, chains such as Wendy’s have been forced to push some of these costs onto the consumer by raising prices at their restaurants.  This has created a double-edged sword for Wendy’s, as they try to raise prices on Americans who, as the economy has fallen into recession, have tightened their wallets.  This is a great example of how fluctuating prices can ripple through an economy and create pressures on supply/demand curves.

Posted by George, Rafael and Armani (Section 3)

Resources:

http://www.toledoblade.com/business/2011/05/11/Wendy-s-Arby-s-to-raise-prices.html

Supply, Demand and Equilibrium

Discussion on Bruce Dybvik’s “The Ripple Effect: Cost of gas and groceries go hand in hand” (Dunn County News, 2008)

This blog talked about the fluctuating prices of petroleum and its wide reaching effects, particularly relating to food. An interesting topic that is described is what they call the wave function. That is, nothing happens in isolation or that everything consists of and is affected by waves or disturbances. An example they gave of this is the rising petrol prices which lead to rising food costs, transportation costs, and more. The rising price of food is linked to both supply and demand and increasing petrol prices. Higher demand leads to higher prices, higher labor costs, and higher marketing costs. Corn prices are affected mostly because it is energy intensive and because there is an effort to divert some corn for ethanol production. Rising food prices are forcing customers to change their product choices and their habits. In order to save money customers are bundling trips, or buying more per trip but going less often. In addition, private label growth has increased lately since it is less expensive. In order to keep their bottom lines at similar levels, producers have started adding fuel surcharges to their invoices. This has forced both retailers and consumers to adapt. They are both choosing different food products, different ways of doing business, and are changing the methods of preparing and buying their foods. An example of this change is buying locally. Since there are fewer or no fuel surcharges these foods tend to be cheaper. In order to promote buying locally many grocery stores have started keeping track of “miles to market.” This number shows how far the food has travelled in order to get to the grocery store. As a last effort to save money, some stores have even started picking up their food rather than having it shipped or transported. This saves money since it does not have to be shipped and there are no fuel surcharges. It seems like both people and retailers have gone back to the old fashioned way of doing things and Yogi Berra described it perfectly, “It’s déjà vu all over again.”

 “Oil prices are at the heart of inflation seen in all sectors of the economy, including food.”

A statement such as this seems to be a very bold one, but once you’ve taken another look, it is not too far off. Although, it does not seem quite fair to completely blame rising oil prices. As the article outlines, oil prices are a major factor, but so is labor costs. With many companies moving, or already moved, to developing nations, finished goods have to be shipped farther. In addition to this, as other countries are developing, labor wages are rising in those countries as well.

This article is relevant to class discussion because it shows how everything is intertwined and the far-reaching effects of supply and demand. It also shows that not all changes can be traced directly to one cause and that everything will eventually reach some sort of equilibrium. For example, consumers and retailers will adapt and change in order to save money and prices will eventually find some sort of stability in the market.

Another real world example that displays the effects of supply and demand is the price of copper in the current economy.  Copper is used in housing and automotive applications but is mainly used by the electrical industry. With the prices of copper remaining relatively high over the past few years, consumers are feeling the effects.  High copper prices paired with an increased demand for electronics, especially in the mobile device category, have caused electronic prices to rise.  From TV’s to cell phones, as well as laptops and even calculators, consumers are being pushed to spend more on the same goods.  This price ripple directly affects not only businesses and education centers that depend on the technology to carry out their mission but family’s and individual consumers as well.  The only positive point for consumers is that while copper costs increase the price, advances in other technology, for example the screens used in computers, are helping to combat an extremely substantial increase that might drive customers to seek drastically different options.

Posted by Blas, Alyssa and Jordan (Section 2)  

Resources:

http://www.huffingtonpost.com/2011/10/07/china-manufacturing_n_1000305.html

Supply, Demand and Equilibrium

Discussion on Bruce Dybvik’s “The Ripple Effect: Cost of gas and groceries go hand in hand” (Dunn County News, 2008)

In the article, “The Ripple Effect,” Bruce Dybvik discusses the way in which the price of gasoline affects all sectors of the economy, including food. In the food sector, gas prices affect “what we choose to eat, the way it is sold and purchased, and even the way we prepare our meals.” When gas prices rise, the cost of shipping food to vendors increases, so the price of food rises. At the same time, consumers’ purchasing habits change from shopping whenever convenient to buying more but less frequently.

As a result of the rising input cost of oil, producers have raised the reserve price on their goods. The resulting rise in the price of the food goods has caused movement upward on the demand curve, suggesting that consumers across the economy will purchase less food at the new, higher price; however, food is not an elastic commodity. Consumers must purchase food, which is why purchasing habits change. Consumers are avoiding using vehicles often by going to the grocery store less frequently, and are purchasing more products at a time. The food that consumers purchase has changed, as well, to include pastas, rice, and other inexpensive products that will cause meals to last longer.

This is a result of the substitution effect, a theory discussed in class. The substitution effect, along with the income effect, helps to explain the inverse relationship between price and quantity demanded. Consumers are finding cheaper alternatives to their regular purchases in order to stretch their budgets. Food vendors have noticed this trend, and stock more of the foods that consumers will purchase. Vendors are stocking more local products and buying in bulk, as well, because of high shipping fees from food suppliers.

The article states, “Oil prices are at the heart of inflation seen in all sectors of the economy including food.” Since oil serves as a major input in the economy, its price fluctuation affects all sectors of the economy. It fuels everything from transportation, the production of everyday items such as ink, deodorant, CDs and DVDs, to important activities like cooking. Oil prices are now consistently on the rise, and as a result, vendors are forced to pay additional fuel surcharges which lead to price increases for consumers. It is difficult for businesses and consumers to avoid being affected by this trend because oil is such a major commodity. Not only that, but production costs tend to increase as a result of this upward trend in oil prices which causes vendors to move prices up for consumers.

Furthermore, consider the real-word example regarding the relationship between gas prices and the use of public transportation. According to the American Public Transportation Association, when gas prices increase there is a sharp acceleration in the amount of passengers regularly on public transit. In fact, during the 2007 and 2008 gas price spike, 85% of transit agencies in the US reported “experiencing capacity constraints on their systems.”  This was even after half of the agencies had added extra lines with expanded service to new areas in order to deal with the overflow. Moreover, studies found that the relationship between the price of gas and usage is rather elastic. When there is even the smallest of increases in price, the more elastic the demand for gas became. Thus people are more inclined to look for an alternative or substitute when some prices of goods reach excessive levels. As a result, we see the pattern that when gas prices increase, the quantity demanded of gas (in the sense of consumers filling up their own cars) decreases, while the demand for public transportation greatly increases. An example like this makes it easy to see why, in the law of demand, price and quantity demanded are inversely related. When there are similar options available to consumers, they will most likely choose whatever option now costs less.

Posted by Marybeth, Kim, Kirsten and Grace (Section 1)

Resources:

Potential Impact of Gasoline Price Increases on U.S. Public Transportation Ridership, 2011-2012. Rep. Washington D.C.: American Public Transportation Association, 14 March 2011. Web. 20 Jan. 2012.  <http://www.apta.com/resources/reportsandpublications/Documents/APTA_
Effect_of_Gas_Price_Increase_2011.pdf>